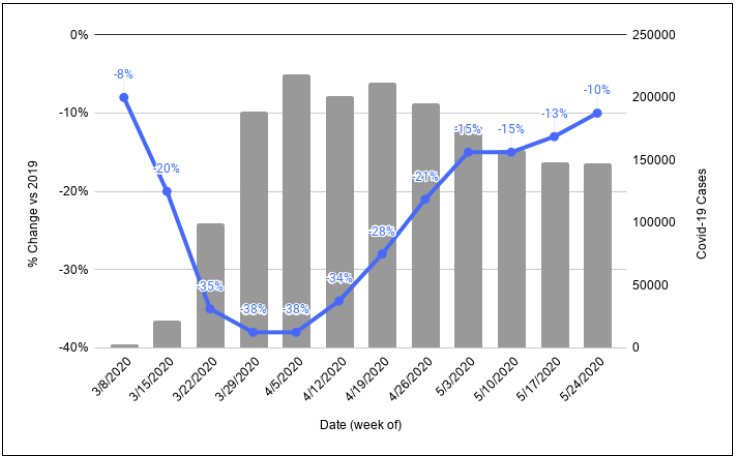
Despite the Memorial Day holiday and protests erupting nationwide, National RO was down only -10% beating our forecast (-11%) by a nose. New Covid-19 cases stayed below 150k for the second week in a row. Our forecast for next week is -11% versus 2019.
Repair Order (RO) activity in the US continues to recover, albeit at a slower pace since early May. The forecast for national RO in our last issue was -12%, which was close but off by 1% with RO activity -13% for the week of May 17 versus the same week in 2019. Meanwhile, new US Covid-19 case counts dropped below 150k for the first time in eight weeks.
On a national level, Repair Order (RO) activity continues to recover (see Figure 1). The forecast for national RO in our last issue was -15%, proving to be accurate. We don’t expect to be this accurate every week but we’ll enjoy it this week.
Two weeks ago we released the inaugural issue of the Aftermarket Pulse, a new collaboration between Full Throttle Technologies, a provider of automotive Repair Order (RO) data and Aftermarket Analytics, a provider of cloud-based software services for demand forecasting and inventory management. In this second issue, we’re sharing updated national Repair Order (RO) data, through the week beginning April 26, and we’re looking closer at three of the hardest hit individual markets. In addition, we are delivering our first set of RO activity forecasts.
National Pulse
On a national level there are clear signs of increasing RO activity after bottoming in early April (see Figure 1). Perhaps this increase is related to protests against shelter in place orders or perhaps it reflects a public growing weary of staying home, especially as weather improves and States begin to ease restrictions on businesses. We may also be seeing pent up demand for deferred vehicle maintenance and repair. In any case, we are encouraged to see what appears to be the formation of a bottom and an upward trend.
The purpose of this white paper is to communicate (1) a new partnership and (2) a new set of data analysis capabilities available to suppliers, distributors and retailers in the automotive aftermarket. The new partnership is a collaboration between Full Throttle Technologies and Aftermarket Analytics. Full Throttle Technologies is a provider of automotive repair order (RO) data and Aftermarket Analytics is a provider of analytical software solutions for demand forecasting and inventory management. Combined, the two companies bring together an extensive network of RO data and cutting edge analytics enabling aftermarket professionals to use RO data to drive inventory decisions and supply chain efficiency.
Data Analytics
Together, our companies provide a unique solution and an opportunity to better understand market level auto repair shop activity. The Full Throttle Technologies team has queried their massive database to provide RO activity by market for the top 20 largest metropolitan markets in the United States for 2019 and YTD 2020. The Aftermarket Analytics team has analyzed these data to provide a market-by-market snapshot of how the Covid-19 crisis has impacted automotive repair activity. The results, as expected, are fairly startling in terms of the extent to which RO activity has dropped while Covid-19 has spread (see Figure 1).
The map above shows temperature anomalies across the Conterminous US for calendar year 2019 through November. These anomalies relate specifically to daily Low temperatures. Where you see red, daily low temperatures were warmer than 20th Century averages (darker reds indicate much warmer daily low temps). Generally speaking, 2019 has been a much warmer than average (vs 20th Century) year, especially in the Eastern US and along the Pacific, Gulf and Atlantic Coasts (where the vast majority of Americans live). The Northern Rockies, Dakotas and western Great Plains areas have seen cooler temperatures but this isn’t as significant for most consumer products businesses because there aren’t as many people in the region.
Why look at daily low temperature anomalies? There could be many reasons but one reason is that some consumer products sell a lot more or a lot less depending on weather. For example, the starter motor in your car is far more likely to fail when the nightly low temperature is really low. So, companies in the automotive aftermarket are accustomed to selling lots of starters in the late fall and winter months when temperatures plummet.
But, what if they don’t plummet? Well, that might lead to lower sales volumes for the starter produce category. It might also leave a lot of starter inventory sitting on shelves at distribution centers. In other words, this can have a major impact on the starter motor supply chain. This appears to be the case in a large portion of the Eastern US where aftermarket companies may have expected lower sales due to milder overnight low temperatures.
At Aftermarket Analytics we’ve built dozens of replacement rate models for companies in the Automotive Aftermarket. In nearly every instance we find automotive part category replacement rates are influenced heavily by geography. Typically we find vehicles driven in colder climates, like in the Upper Midwest or in New England, have higher replacement rates. The opposite is also true for some part categories vulnerable to extreme heat. As a result, we’ve spoken to a number of parts suppliers and distributors who are very interested in a better understanding of the relationship between climate and demand for replacement parts.
More recently, we’ve heard that unseasonably warm or cool weather patterns, perhaps related to climate change, are making it more difficult to accurately forecast demand for a number of key replacement part categories. In response, we are offering a new service in 2020 to help the industry address these concerns.
I’m pleased to announce that Aftermarket Analytics will begin offering a Climate Data Portal (CDP) service beginning in Q1 2020. Our CDP will provide historical and current climate and weather data, including temperature and precipitation normals along with recent daily precip and temp highs and lows for all key markets in the U.S. The portal will enable Category Management professionals and inventory managers to identify unusual weather patterns, calculate anomalies and quantify relationships between climate variables and location specific part sales. Data in the CDP will be updated on an ongoing basis and will be easy to manipulate, visualize and download for further analysis.
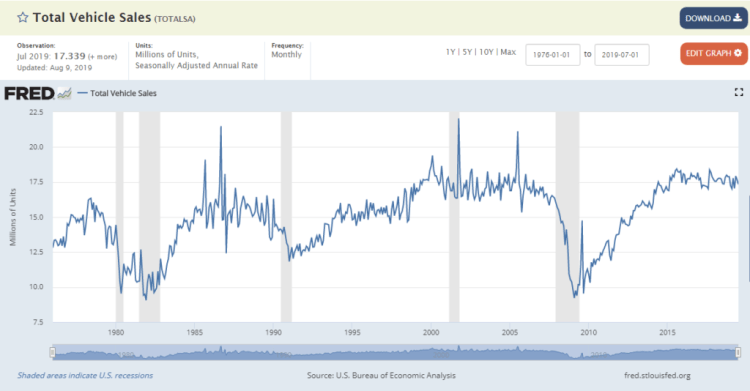
This line chart (from the St. Louis Fed website) is one I’ve looked at many times. It tells an interesting story.
It shows monthly new car sales volume in the US going all the back to Jan 1976. Along the horizontal x-axis we have the monthly time series beginning Jan 1976 on the left moving through time until the present with last month’s car sales on the far right. Along the vertical y-axis we see new car sales volume in millions. In Jan 1976 the annual rate of new car sales, seasonally adjusted, was approximately 12.8 million. More generally, car makers were selling about 14-15 million units annually during the late 1970s. Last month, Jul 2019, the seasonally adjusted annual rate was approximately 17.3 million units, which is about where it’s been for the past 5 years. It’s been a roller coaster ride but for the domestic automotive industry volume is only up 15-20% over more than 40 years. Thankfully for the industry global growth has more than made up for relatively stagnant domestic sales.
How is this relevant a decade later? In the Automotive Aftermarket it’s extraordinarily relevant because the “sweet spot” for automotive parts suppliers, distributors and retailers is about 10 years, more or less depending on the part category. So, while most of the economy has moved past the calamity of 2008-2009 recession, the Aftermarket is still dealing with the fallout. On the flip side, during the next decade the US aftermarket industry should experience growth mirroring the upward slope we see between 2010 and 2014. For investors or entrepreneurs looking for a silver lining in recent market volatility and increasing fears of a recession, the automotive aftermarket could provide a nice counter-cyclical investment opportunity.
I’m very pleased to announce the release of Inventory Analyst 2.0 (IA2). This new version has the same easy-to-use interface along with all the great features and functionality in the previous version plus a plethora of new features making IA2 the most robust inventory solution in the Aftermarket.
New features in IA2:
Generate Stocking Recommendations (Add, Keep or Remove)
Upload and analyze Sales History data
Upload and analyze Inventory-on-Hand (IoH) data
Custom business logic for stocking recommendations incorporating IoH, Sales History, VIO, Replacement Rates, Part Rankings and other data elements
Upload store locations, by channel
Auto-select regions around a store location based on sales history
Convert recommendations to custom format for order/return
Download data to Excel worksheet with custom functions and formatting
We’re working hard to build the best possible inventory solution for suppliers and distributors in the Aftermarket. If you would like to learn more about IA2, please contact us today!
General Motors announced a significant headcount reduction and closing of several plants on 11/26/18. There are three major factors that led to this.
One is a flat market for new vehicle sales in 2018. Rising interest rates have largely killed the zero-rate financing deals, and have increased payment sizes and lease rates for most vehicle purchases. Absence of major new models also contributes to the flat market. As a result, 2018 US new vehicle sales are up a tiny 0.2%vs. 2017 YTD through October.
Second, there continues to be a significant change in the mix of new vehicle sales. Figure 1 is a chart from the Wall Street Journal article about General Motors announcement in late November 2018.


